


- Setup is a Cloud project, two APIs, a credential, and one step people miss: granting that credential access inside Analytics. [20]
- Google’s official Analytics MCP server is read-only by scope, not by promise, and ships seven tools. [1]
- Editors are not interchangeable: VS Code reads a
serverskey, Cursor readsmcpServers. [8][9] - MCP is for asking while you watch. Code is for anything that runs on a Monday without you.
- One
fetch.mjswritesdata.json. The dashboard, the email, and the alert all read it and call nothing. [21] - Cohort retention is one
cohortSpec. The interface has no screen for it. [4] - Funnels work, but only in
v1alpha, and Google says to expect breaking changes. [5] - Every response says whether it was sampled, thresholded, or truncated. Almost nothing reads it. [6]
- Budget: 200,000 core tokens a day, 40,000 an hour, 10 concurrent, on a standard property. [2]
- Schedule against the data, not the calendar: processing can take 24 to 48 hours. [11]
Most guides to this stop at the demo. You connect a server, you type a question, an assistant answers, and the article ends on how remarkable that is. It is remarkable for about a day. Then you want the same answer every Monday without typing anything, you want it to reach people who will never open a dashboard, and you want to know whether the number is even complete.
This is the whole path instead. Setup from an empty Google Cloud console, the choice between the two ways in, how to ask so the answer is reproducible, and then four things worth building on top. Only one of them is a dashboard.
00What you are actually building
Before the setup, the destination, because it changes which decisions matter.
One scheduled pull
A small script authenticates, sends a single request, computes the comparisons, and writes one file called data.json. This is the only thing that ever talks to Google.
Four things read that file
An HTML dashboard. A cohort grid and a funnel the Analytics interface will not draw for you. A written weekly summary that goes out by email. A Slack alert that stays silent unless something real moved.
Costs nothingA human signs the ones that leave the building
The dashboard and the alert can run unattended. Anything a client reads gets a person in front of it, because the week a tracking change breaks is the week the report looks most dramatic.
JudgmentThat split is the whole architecture. Adding a fifth destination later costs a reader, not another API call, so the quota bill does not move.
01Google Cloud, from an empty console
An Analytics property you can administer, a Google account, and about an hour. On the machine: Node 18 or newer for the scripts, and pipx for the server, which Google’s own instructions require. [1] You also need your property ID, the numeric one: open Analytics, then Admin, then Property settings, and it sits at the top right. It is not the G- measurement ID from your tag, which is a different thing entirely.
Analytics data does not come out of Analytics. It comes out of a Google Cloud project that you own, which is why this step exists even though nothing about it feels like marketing.
Create a project, then enable exactly two APIs in it: the Analytics Admin API, which lists what accounts and properties exist, and the Analytics Data API, which returns the numbers. [1] Google’s own server needs both. [1]
Then the credential, and the choice here is the one that bites later.
| Application Default Credentials | Service account | |
|---|---|---|
| What it is | your own Google login, cached locally | a robot identity with its own email address |
| Sees | exactly what you see in Analytics | exactly what you grant it, and nothing else |
| Right for | your laptop, exploring | anything scheduled or shared |
| Breaks when | you rotate access or someone else runs it | never, unless you remove its access |
On a laptop, Application Default Credentials are the sane default precisely because they are not special. Google’s own line asks for the read-only Analytics scope: [1]
gcloud auth application-default login \
  --scopes https://www.googleapis.com/auth/analytics.readonly,\
https://www.googleapis.com/auth/cloud-platform \
  --client-id-file=YOUR_CLIENT_JSON_FILE
The moment anything runs on a schedule, switch to a service account. And here is the step that quietly costs people an afternoon.
A service account is a Google Cloud identity. It is not a Google Analytics user until you make it one. Copy its email address, open Admin, then Property access management in Analytics, and add it with the Viewer role, which can “see settings and data” and nothing more. [20] Skip this and every credential is valid, every API is enabled, and every request comes back empty or denied. Nothing in the error tells you which of the two systems is unhappy.

02Connecting the assistant
Google publishes an official server for this, and its own title for it is Google Analytics MCP Server (Experimental). [1] Read that label as a version number rather than a warning. The Model Context Protocol it speaks is simply the standard way an assistant reaches an outside system.
Seven tools, in three groups. get_account_summaries, get_property_details, and list_google_ads_links tell the assistant what exists. run_report, run_funnel_report, and get_custom_dimensions_and_metrics do the reporting. run_realtime_report covers the live view. [1]
Every one of them reads. Nothing creates a property, edits a key event, or touches a data stream, and the guarantee is stronger than a tool list, because the README requires credentials carrying the read-only scope https://www.googleapis.com/auth/analytics.readonly. [1] The permission forbids the write. On any community server, check that same thing: a tool list is a claim about behavior, a scope is a limit on capability, and anything asking for more than read access to produce a report is asking for permission it does not need.
The command comes from Google’s README, which is the version to trust: [1]
claude mcp add analytics-mcp \
  --scope user \
  -e "GOOGLE_APPLICATION_CREDENTIALS=PATH_TO_CREDENTIALS_JSON" \
  -e "GOOGLE_PROJECT_ID=YOUR_PROJECT_ID" \
  -- pipx run analytics-mcp
One wrinkle worth knowing before it costs you twenty minutes: the README’s prose recommends a GOOGLE_CLOUD_PROJECT variable while the JSON example beside it sets GOOGLE_PROJECT_ID. [1] If the server starts but cannot resolve a project, check that first.
Every serious editor speaks this protocol now, but the config files are not interchangeable and the failure is silent.
| Editor | File | Top-level key | Notes |
|---|---|---|---|
| Claude Code | .mcp.json, or the CLI |
written for you | --scope picks local, project, or user [7] |
| VS Code | .vscode/mcp.json |
servers |
MCP: Add Server writes it through a guided flow [8] |
| Cursor | .cursor/mcp.json |
mcpServers |
stdio, SSE, and streamable HTTP [9] |
| Gemini CLI | ~/.gemini/settings.json |
mcpServers |
the setup Google’s README documents first [1] |
Paste a Cursor block into VS Code and nothing happens, because VS Code looks for servers and finds mcpServers. [8][9] No error, no server, no clue. When it is wired, ask it what properties you have. If it lists them, both locks are open.
03Two ways in, and when each one is right
You now have a connection, and there are two ways to use it. This is not a rivalry. It splits on one question: is a human watching?
| MCP, in a conversation | The Data API, in code | |
|---|---|---|
| Good at | open questions, iteration, following a hunch | scheduled pulls, versioned logic, anything reused |
| Time to first answer | minutes | an afternoon, including auth |
| Who approves the call | you, in the session | nobody. It runs at 6 a.m. |
| Where the logic lives | in the conversation, gone tomorrow | in a file, in git, reviewable |
| Failure mode | a slightly wrong dimension, which you notice | the job dies quietly and you find out Friday |
The fourth row decides it. A question you asked once is not an asset. The moment you want the same numbers next week, in the same shape, the work belongs in code, because that is the only place a definition survives being forgotten.
So the sequence is: explore in MCP until you know what the report should say, then move that settled request into a file. Everything in section 06 depends on having done the first half honestly.
Both spend from one published budget. A standard property gets 200,000 core tokens per day and 40,000 per hour with 10 concurrent requests, while a single Cloud project is separately capped at 14,000 core tokens per property per hour. Analytics 360 raises every token ceiling tenfold, to 2,000,000 a day, and lifts concurrency to 50. [2] Tokens are charged by query complexity rather than request count, which surprises people: one wide report can cost more than a dozen narrow ones.
04Asking so the answer is reproducible
Connected, you can type anything and get an answer. The trouble is that a good answer and a lucky one look identical.
Which channels did best last week?
It will answer. It will also pick a date range, guess which of several channel dimensions you meant, and choose its own row limit, and none of those three decisions appears in the reply. Ask again next week and you may get a different set of choices, which is fine while you are exploring and fatal the moment anything depends on it.
Four things it cannot guess, so you supply them:
Property 284916037. Compare 2026-07-21 to 2026-07-27 against
2026-07-14 to 2026-07-20.

Dimension sessionDefaultChannelGroup, metric engagedSessions,
ordered by engagedSessions descending, limit 5.

Report the ResponseMetaData with the rows.
Property, both windows, API names, limit. Names matter because they are their own vocabulary, not the labels you see on screen: eventName, pagePath, deviceCategory, country, defaultChannelGroup. [12] Ask for “channels” and you get a plausible guess. Ask for sessionDefaultChannelGroup and you get the column you meant.
The last line is the one people leave off, and it is what turns a confident table into a checkable one. Section 05 is about why.
Here is what that prompt became, and what came back.
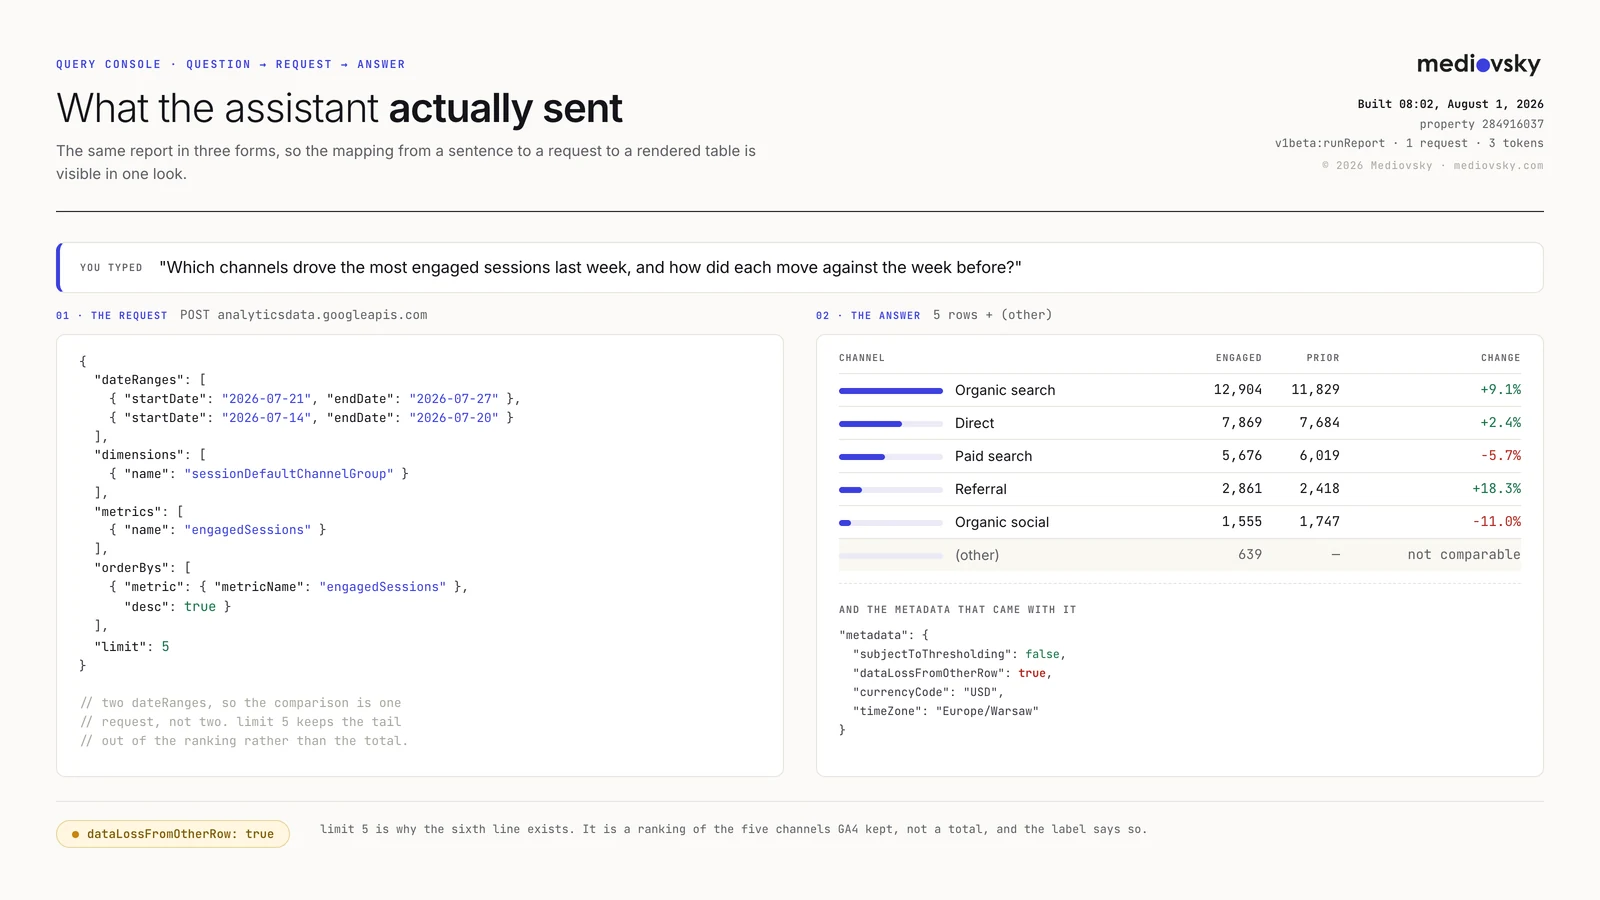
Two structural details are worth stealing. dateRanges takes an array, so two entries give you a period comparison in one response instead of two calls you have to align yourself. And limit is a real decision: Google returns at most 250,000 rows per request whatever you ask for, and 10,000 if you do not specify. [10] A small limit is usually right, and it is also what creates the (other) row.
Questions worth asking, once it works:
- Which landing pages lost the most organic sessions week on week, and by how much?
- Which channel’s engaged-session rate moved most, ignoring anything under 500 sessions?
- What are the top 20 events by count, and which are new since last month?
- Which pages have high traffic and no key events at all?
- Break revenue down by device, and tell me what the data cannot explain.
That last clause is a habit worth building. A model asked what it cannot determine will usually tell you, and the answer is often the most useful line in the reply.
05Knowing when the number is lying
Every report comes back with a metadata block describing the conditions it was produced under, and virtually every tool throws it away while keeping the rows. [6] Four fields decide whether a number means what its label says.
| Field | Google’s description | What it means for you |
|---|---|---|
subjectToThresholding |
“If true, this report is subject to thresholding and only returns data that meets minimum aggregation thresholds.” [6] | Rows were withheld for privacy. Your total is incomplete, and no error was raised |
dataLossFromOtherRow |
“If true, indicates some buckets of dimension combinations are rolled into “(other)” row.” [6] | A ranking on this is a ranking of what survived, not of everything |
samplingMetadatas |
“If this report results is sampled, this describes the percentage of events used in this report.” [6] | Estimates, not counts. The rate is computable per date range |
emptyReason |
“If empty reason is specified, the report is empty for this reason.” [6] | The difference between zero and no answer, which a chart cannot show |
Sampling is the one that gives you a number rather than a boolean: samplesReadCount over samplingSpaceSize is your rate. [6] Only one of the three conditions is entirely out of your hands.
Thresholding is privacy machinery, applied “to prevent anyone viewing a report or exploration from inferring the identity or sensitive information of individual users,” and it engages around demographics, audiences built on them, and search-query data with too few users. [13] You cannot negotiate: “Data thresholds are system defined. You can’t adjust them.” [13] A wider date range makes it less likely.
Sampling is a quota. Google puts the event-level query limit at 10 million events on a standard property, with Analytics 360 running to 1 billion from a default of 100 million per query. [14] Shorter windows and fewer dimensions keep you under it.
The (other) row is cardinality: “a row that appears in a report, exploration, or Data API response when the number of rows in a table exceeds the table’s row limit.” [15] Google warns that “any dimension with more than 500 values should be considered a high-cardinality dimension,” and its advice is blunt: use existing dimensions before creating custom ones, and never build one that gives each user a distinct identifier. [15]

All three vanish in the raw export, which is the honest escape hatch when a figure has to be complete rather than indicative. That path has its own ceiling: a standard property’s daily BigQuery export stops at 1 million events per day, and Google pauses it rather than catching up if you consistently exceed it. [16] It is the same reasoning behind treating the interface as a privacy-filtered view and the warehouse as the record.
06One pull, four different things
Now the part that pays for the setup. Everything below reads one file, and only the first script ever calls Google.
The pull
One dependency, Google’s own Node library, whose default constructor reads the credential from GOOGLE_APPLICATION_CREDENTIALS: [21]
npm install @google-analytics/data

export GOOGLE_APPLICATION_CREDENTIALS=/path/to/key.json
export GA4_PROPERTY_ID=284916037
node fetch.mjs
Two environment variables and one command. That writes data.json beside the script, and everything below reads it. Here is fetch.mjs in full.
// Auth, one request, all arithmetic, one file out.
import { BetaAnalyticsDataClient } from '@google-analytics/data';
import { writeFileSync } from 'node:fs';

const PROPERTY = process.env.GA4_PROPERTY_ID;
const client = new BetaAnalyticsDataClient();

const [report] = await client.runReport({
  property: `properties/${PROPERTY}`,
  dateRanges: [
    { startDate: '2026-07-21', endDate: '2026-07-27' },
    { startDate: '2026-07-14', endDate: '2026-07-20' },
  ],
  dimensions: [{ name: 'sessionDefaultChannelGroup' }],
  metrics: [{ name: 'engagedSessions' }],
  orderBys: [{ metric: { metricName: 'engagedSessions' }, desc: true }],
  limit: 5,
});

// Two date ranges means the API appends a dateRange dimension, so both
// windows arrive in one list and get split apart by that last value.
const bucket = (key) => Object.fromEntries((report.rows ?? [])
  .filter((r) => r.dimensionValues.at(-1).value === key)
  .map((r) => [r.dimensionValues[0].value, Number(r.metricValues[0].value)]));

const now = bucket('date_range_0'), prev = bucket('date_range_1');

// Arithmetic lives here, in code, where it is testable and identical every run.
const findings = Object.keys(now).map((name) => {
  const a = now[name], b = prev[name] ?? 0;
  return { name, now: a, prev: b, abs: a - b,
           pct: b ? Number((((a - b) / b) * 100).toFixed(1)) : null };
});

const m = report.metadata ?? {};
writeFileSync('data.json', JSON.stringify({
  builtAt: new Date().toISOString(),
  property: PROPERTY,
  // Kept, not stripped. This is what keeps every reader below honest.
  quality: {
    sampled: (m.samplingMetadatas ?? []).length > 0,
    thresholded: Boolean(m.subjectToThresholding),
    truncated: Boolean(m.dataLossFromOtherRow),
    currencyCode: m.currencyCode ?? null,
    timeZone: m.timeZone ?? null,
  },
  findings,
}, null, 2));
Sixty lines, and everything after this reads its output. Note what it does with the metadata: it keeps it, in a quality object that travels with the numbers.
Output one: the dashboard
A single self-contained HTML file. No build step, no dependencies, no login. It opens instantly, works on a phone with bad signal, prints to a clean PDF, and nobody can change it under you. The prompt that produces one is long on purpose, because every line exists to prevent something worse.
Read data.json and write ONE self-contained HTML file.

No external requests of any kind: no CDN scripts, no web fonts, no
remote images, no fetch calls. Inline all CSS. Charts are
hand-written inline SVG, not a charting library.

Layout: a header with the property, the date range and the build
timestamp; the figures as tiles with a percentage change each; the
main table with a share bar per row; a one-line status strip along
the bottom.

Every number comes from data.json. If a field is missing, render
"no data", never a zero. A zero and a missing value are different
things and must never look the same.

Format currency with quality.currencyCode and times with
quality.timeZone. Do not assume dollars and do not assume UTC.

The status strip reports the sampling rate, whether thresholding
was applied, whether an (other) row is present, and how many
requests built the page.

Any table where quality.truncated is true is labeled a top-N,
never a total, and shows the (other) row rather than dropping it.
Inline SVG rather than a library is not aesthetic preference. A sparkline is a polyline with eight points, so the library was never buying much, and it can cost you the chart outright: many sites run a content security policy, the browser rule deciding which scripts may execute, and a strict one blocks the runtime code generation some charting libraries need. [17] You get a container and no chart, with nothing in the page explaining why.
Output two: the reports the interface will not draw
Two report types take a single request and are either unavailable or miserable in the Analytics interface.
Cohort retention. Add a cohortSpec to a normal runReport and Google builds “a time series of user retention for the cohort.” [4]
"cohortSpec": {
  "cohorts": [
    {
      "dimension": "firstSessionDate",
      "dateRange": { "startDate": "2020-12-01", "endDate": "2020-12-01" }
    }
  ],
  "cohortsRange": { "endOffset": 5, "granularity": "DAILY" }
}
Switch granularity to WEEKLY, widen endOffset, and you get the grid that tells you whether a product change actually stuck.
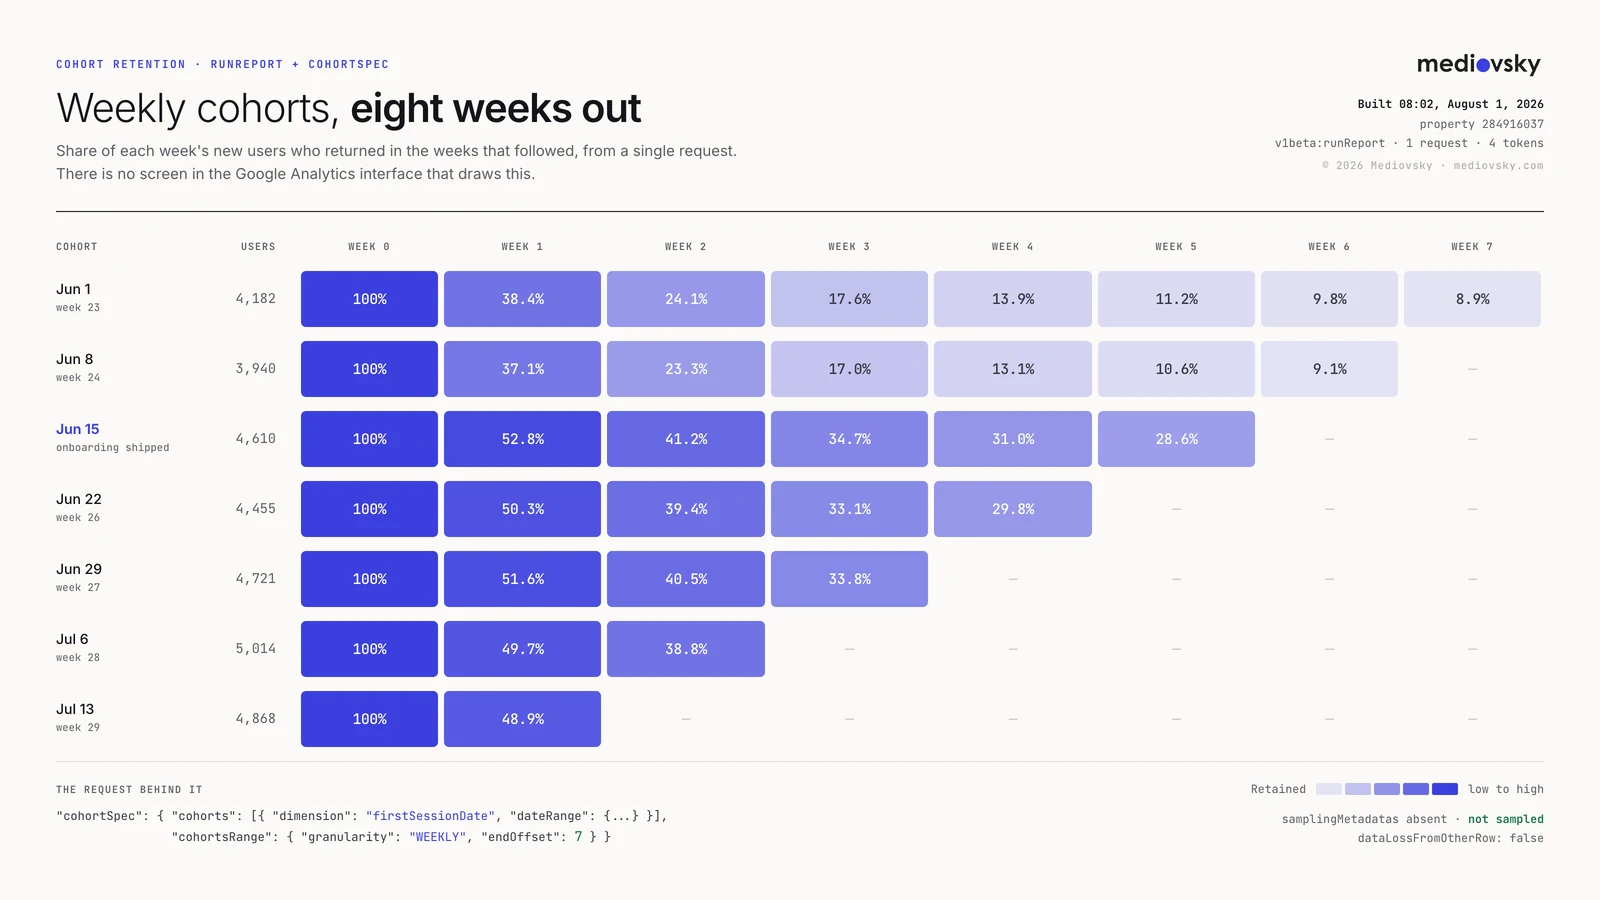
That shape answers a question a line chart cannot: not “did retention improve” but “did it improve for people who arrived after the change, and did it hold.” Weekly totals would have shown a mild lift and buried the cause.
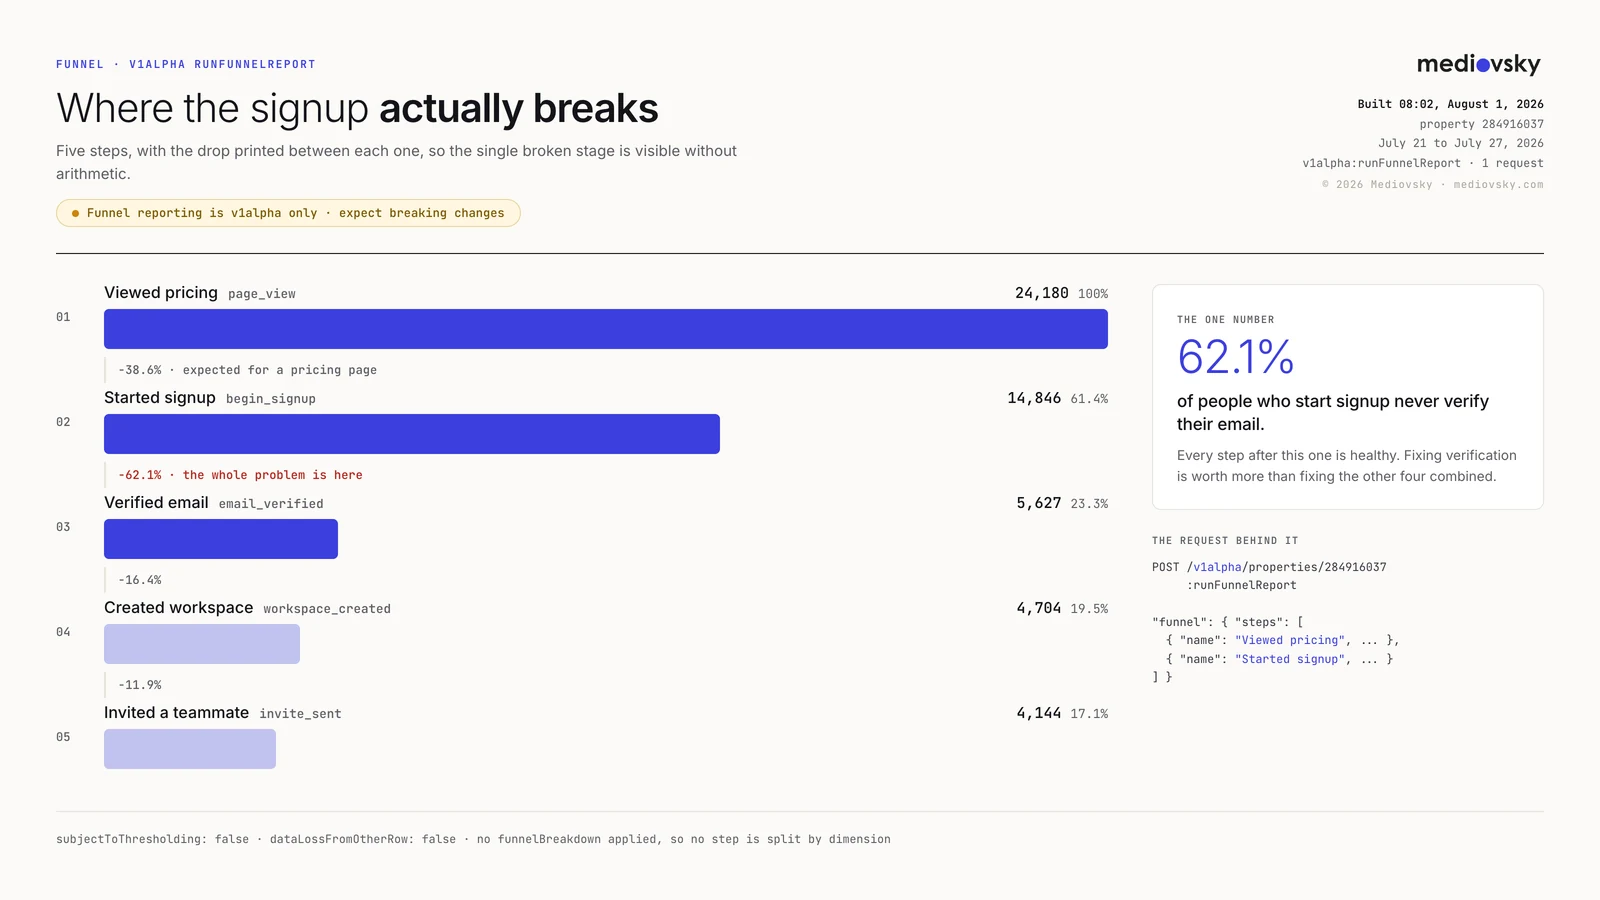
Funnels use runFunnelReport, with steps defined by filter expressions, and there is a real catch. Google is explicit: “Funnel reporting feature is only available in the v1alpha version of the Google Analytics Data API. While we will try to notify you of upcoming changes, you should expect to encounter breaking changes before this feature is publicly released.” [5] Use it in conversation, keep it out of the scheduled job.
Output three: the written weekly summary
The dashboard serves people who open dashboards. Most stakeholders do not. What they read is an email, and this is where a language model earns its place, because turning eleven computed facts into four readable sentences is exactly what it is good at.
The rule that keeps it safe: the model receives findings and never the raw rows, so it has nothing to compute with.
You are writing the analytics section of a Monday update. You are
given a JSON object with computed findings. Every number in it is
already correct. Do not recalculate anything, and do not introduce
a figure that is not in the input.

Write at most five sentences. Lead with the single largest mover in
absolute terms, not percentage terms. Group anything smaller into
one closing sentence.

If quality.thresholded or quality.truncated is true, open with one
short sentence saying which parts of the picture are incomplete.

Do not explain why anything changed. You do not have deploy logs,
campaign calendars, or seasonality. If a cause seems obvious, say
what you would need in order to check it.
That last paragraph is the whole discipline. Analytics does not know a deploy shipped on Wednesday, so any “because” in the draft came from the model, not the data. Forbidding causal language costs nothing and removes the single most common way these summaries become confidently wrong.
Output four: the alert that stays quiet
An alert is the opposite of a report. Its job is to send nothing almost every week. alert.mjs reads the same file and posts to a Slack incoming webhook, which takes a JSON body as simple as {"text": "Hello, world."} at a URL of the form https://hooks.slack.com/services/T00000000/B00000000/XXXXXXXXXXXX. [22]
import { readFileSync } from 'node:fs';
const { findings, quality } = JSON.parse(readFileSync('data.json', 'utf8'));

// A truncated report can fake a collapse, so it never raises an alarm.
if (quality.truncated) process.exit(0);

// Two conditions, not one: a big percentage on a small number is noise.
const breached = findings.filter((f) =>
  f.pct !== null && Math.abs(f.pct) >= 15 && Math.abs(f.abs) >= 500);
if (!breached.length) process.exit(0);   // silence is the default

const lines = breached.map((f) =>
  `${f.name}: ${f.pct > 0 ? '+' : ''}${f.pct}%  (${f.now} vs ${f.prev})`).join('\n');

await fetch(process.env.SLACK_WEBHOOK_URL, {
  method: 'POST',
  headers: { 'Content-type': 'application/json' },
  body: JSON.stringify({ text: `*Engaged sessions moved*\n${lines}` }),
});
Two thresholds rather than one is the design decision that matters. A 40% rise on 12 sessions is noise. A 6% fall on 40,000 sessions is the only thing worth waking up for. Requiring both a relative and an absolute move stops small denominators generating drama.
The same file can reach anywhere that accepts an HTTP request. Email through a transactional provider, SMS or push through a messaging one, a row appended to a sheet. Each is another reader of data.json, which is why adding one does not touch quota, credentials, or the pull.
Pull once, compute in code, then render or deliver, as many times as you like.
One request, four destinations, one set of numbersThe GA4 dashboard prompt pack
Every prompt in this piece on one page, in running order, plus the review pass that catches a page implying more precision than its data supports.
- Pull the data, keeping the response metadata instead of stripping it
- Build one self-contained page with hand-written SVG and no external requests
- Write the weekly summary without letting the model compute or speculate
07Letting it run without letting it lie
Three layers, and only one of them gets to be creative. The script pulls and writes. Code computes every comparison, because arithmetic has a correct answer and belongs somewhere testable. Only then does a model turn surviving facts into prose.

Then schedule against the data rather than the calendar. Google states that “Data processing can take 24-48 hours. During that time, data in your reports may change,” with standard properties typically seeing intraday data in 2 to 6 hours and 360 properties seeing it in about an hour. [11] A Monday 6 a.m. job reporting on Sunday sits inside that window. If you pull Search Console alongside, it adds its own caveat: “The newest data can be preliminary, meaning it’s still being collected and might change in the next few hours.” [18] It also meters separately, at 1,200 queries per minute per site, and warns that grouping or filtering by page or query is the expensive shape. [19]
The fix is unglamorous: end the reporting window a day or two before the run, and print on every output which window it covers.
Scheduling itself is one line. On a server, a crontab entry. On a hosted runner, the same expression in its own scheduler:
# m h dom mon dow   command
  0 7  *   *   2     cd /srv/report && node fetch.mjs && node alert.mjs
Tuesday rather than Monday, and seven rather than six, for the reason above: it puts the whole reporting window outside the processing lag instead of racing it.
A report that silently arrives incomplete is worse than one that does not arrive.
Almost every early break is plumbing: an expired credential, a property whose access was granted by someone who left, a quota error swallowed by a retry, a report that quietly changed shape. Make each fail loudly and stop the send. A missing email prompts a question. A thinner-than-usual email prompts a decision, made on numbers nobody knows are partial.
Keep the human gate on anything a client reads. It costs a minute and catches the week when a tracking change made every number look catastrophic. The dashboard and the alert can run unattended, because the worst case is a page nobody opened and a message nobody needed.
- Grant the service account Viewer on the property, not just a valid credential. [20]
- Name dimensions and metrics by their API names, so the assistant stops guessing. [12]
- Put both periods in one
dateRangesarray rather than making two calls. [3] - Keep the metadata beside the numbers, and render what it says. [6]
- Give the model finished figures and forbid causal language.
- Require two thresholds before an alert fires, one relative and one absolute.
- Keep funnels out of unattended jobs while the endpoint is alpha. [5]
- Send figures that must be complete to the export, and mind its 1-million-event ceiling. [16]
Two years ago wiring a model into an analytics property was a project. Now it is an afternoon, and the setup is the least interesting thing in this piece. What is left is the part that was always hard: choosing which question is worth answering every week, and knowing whether the answer you got is the one you think it is.
Sources
- Google · Google Analytics MCP Server (Experimental)the seven tools, the two APIs to enable, the analytics.readonly scope, the claude mcp add and gcloud commands, and the GOOGLE_CLOUD_PROJECT versus GOOGLE_PROJECT_ID mismatch
- Google · Analytics Data API v1 quotas200,000 daily and 40,000 hourly core tokens, 14,000 per project per property per hour, 10 concurrent requests; 2,000,000 and 50 on 360
- Google · Analytics Data API v1 basicsthe runReport endpoint and the dateRanges, dimensions, and metrics request body
- Google · Advanced use casescohortSpec structure, and that cohort reports create a time series of user retention for the cohort
- Google · Funnel reportsrunFunnelReport, and the warning that funnel reporting is v1alpha only with breaking changes expected
- Google · Analytics Data API ResponseMetaDatasubjectToThresholding, dataLossFromOtherRow, samplingMetadatas with samplesReadCount and samplingSpaceSize, and emptyReason
- Anthropic · Connect Claude Code to tools via MCPclaude mcp add, the transport flags, and local, project, and user scopes
- Microsoft · Use MCP servers in VS Codenative support, the servers top-level key in .vscode/mcp.json, and the MCP: Add Server command
- Cursor · Model Context Protocol.cursor/mcp.json with the mcpServers key, and the stdio, SSE, and streamable HTTP transports
- Google · Method: properties.runReporta maximum of 250,000 rows per request, and 10,000 returned when limit is unspecified
- Google · Data freshness for Google Analytics“Data processing can take 24-48 hours”; 2-6 hours intraday on standard properties, about 1 hour intraday on 360
- Google · API dimensions and metricsthe API-name vocabulary, including sessionDefaultChannelGroup, engagedSessions, firstSessionDate, eventName, pagePath, and deviceCategory
- Google · Data thresholdsthe purpose of thresholding, and that thresholds are system defined and cannot be adjusted
- Google · About data samplingthe 10 million event-level query limit on standard properties, 1 billion on 360 from a 100 million default
- Google · About the (other) rowthe definition of the (other) row, the 500-value high-cardinality guidance, and the advice against per-user custom dimensions
- Google · BigQuery Export for Google Analytics 41 million events per day on the standard daily export, paused without reprocessing when exceeded
- MDN · Content-Security-Policy: script-srchow a policy without unsafe-eval blocks runtime code generation, which is what silently kills library-drawn charts
- Google · Search Console Performance reportthe newest data can be preliminary and might change in the next few hours
- Google · Search Console API usage limits1,200 queries per minute per site, and the warning that grouping or filtering by page or query is expensive
- Google · Analytics roles and data restrictionsProperty access management, and the Viewer role that can see settings and data
- Google · Data API quickstart with client librariesthe @google-analytics/data package, BetaAnalyticsDataClient, and the default constructor reading GOOGLE_APPLICATION_CREDENTIALS
- Slack · Sending messages using incoming webhooksthe webhook URL format and the JSON body shape a POST must carry
Frequently asked questions
What do I need before connecting GA4 to an AI assistant?
A Google Cloud project with the Analytics Admin API and the Analytics Data API enabled, a credential, and access granted inside Google Analytics itself. That last step is the one people miss: a service account is not a Google Analytics user until you add its email address under Admin, Property access management, with at least the Viewer role.
Is there an official Google Analytics MCP server?
Yes. Google publishes it at github.com/googleanalytics/google-analytics-mcp and titles it Google Analytics MCP Server (Experimental). It runs locally through pipx and exposes seven tools, all of them reads: get_account_summaries, get_property_details, list_google_ads_links, run_report, run_funnel_report, get_custom_dimensions_and_metrics, and run_realtime_report.
Can an MCP server change my Analytics configuration?
Google’s cannot. Its README requires credentials carrying the read-only Analytics scope, so the permission forbids writes rather than the tool descriptions merely promising it. On any community server, read the scope on the consent screen instead of the claim in the README.
Should I use MCP or the Data API?
Both, for different jobs. MCP is a conversation, so it suits open questions while a human is present to catch a wrong turn. The Data API in code suits anything scheduled, because a cron job has nobody to approve a tool call. The working sequence is to explore in MCP until you know what the report should say, then move that settled request into a file.
What does the fetch script actually do?
It authenticates with the service account, sends one runReport call, splits the two date ranges apart, computes every change in plain JavaScript, and writes data.json with the response metadata kept alongside the numbers. It is the only file that talks to Google. The dashboard, the email, and the alert all read that file and make no API calls of their own.
Can it do more than dashboards?
That is the point of splitting the pull from the render. The same data.json feeds an HTML dashboard, a written weekly summary sent by email, and a Slack alert that fires only when a change clears a threshold. Adding a channel means adding a reader, not another API call, so the quota cost does not change.
How do I stop the model from inventing numbers?
Never let it compute one. The fetch script does the arithmetic in code, where it is testable and identical every run, and the model receives finished figures and writes sentences about them. Forbid causal language too, because Analytics does not know that a deploy shipped on Wednesday, so any because in the draft came from the model.
How do I know when a GA4 number is incomplete?
Read the ResponseMetaData block that comes with every report. subjectToThresholding means privacy suppression removed rows, dataLossFromOtherRow means values were rolled into an (other) row, and samplingMetadatas gives samplesReadCount over samplingSpaceSize so you can compute the sampling rate. None of them raise an error.
What are the Data API quota limits?
A standard property gets 200,000 core tokens per day and 40,000 per hour, with 10 concurrent requests, and a single Cloud project is separately capped at 14,000 core tokens per property per hour. Analytics 360 raises every token ceiling tenfold and lifts concurrency to 50. Tokens are charged by query complexity, not request count.
When should the scheduled job run?
Later than feels natural. Google says data processing can take 24 to 48 hours and that reports may change during that window, with standard properties typically seeing intraday data in 2 to 6 hours. End the reporting window a day or two before the run, and print on the output which window it covers.
Do funnels work through the API?
Yes, through runFunnelReport, but Google warns that funnel reporting is only available in the v1alpha version and that you should expect breaking changes before it is publicly released. Use it interactively, and keep it out of anything scheduled and unattended until it settles.

Mikołaj Salecki
Writes about media, tech, and AI business for people who actually run digital. Former agency lead. Skeptic of frameworks that read better than they perform.